Intensity metrics are calculated simply by dividing the total emissions produced by your company/business unit/facility by the number of specified units attributable to your company/business unit/facility.
For example, to work out a company-level Per $ Revenue intensity metric, your total emissions would be divided by your total revenue:
Per $ Revenue = Total emissions (gCO2e) / Total Revenue ($)
Consistently reporting on defined intensity metrics allows you to:
1. Compare your GHG Inventories (total green house gas emissions) year on year, and track emissions reduction progress. If you are implementing reduction initiatives but your company is growing quickly, the company’s total emissions are likely to increase, but the emissions per unit may decrease as the reduction initiatives take place.
Example: Suppose in 2019 your total emissions were 300,000 tCO2e (tonnes of CO2 equivalent) and your revenue was $200mn. You implemented a number of emissions reduction activities, including switching to electric transportation, reducing your employees’ business travel and optimising your procurement practices to buy from local suppliers. However in 2021 your total emissions rise to 400,000 tCO2e, although in the meantime your company revenue has doubled to $400mn. The absolute emissions increase could suggest that your initiatives have failed, however measuring a per $ revenue intensity metric allows you to see that your reduction initiatives have actually been effective to some degree as the kgCO2e/$ revenue value has decreased from 1.5 in 2019 to 1 in 2021.
2. Compare the emissions impact of your Business Units and Facilities, and make informed decisions on setting ambitious reduction initiatives.
Example: Suppose you have 10 warehouses in your estate. Each warehouse is of a different size, but they all perform similar purposes in your value chain. When calculating total emissions, you may find that each of these 10 warehouses yields a similar total emissions number (tCO2e) and may be tempted to implement blanket reduction initiatives. However, identifying that your smaller warehouse in Birmingham has 50 kgCO2e / SQM emissions intensity, while the average value for comparable warehouses in your estate is 25 kgCO2e / SQM, will allow you to focus on this facility and define the appropriate targeted interventions (e.g. switching to a renewable electricity tariff for this facility).
3. Compare your company’s emissions impact to industry benchmarks and leaders; and share the message with your customers. By taking absolute size and revenue out of the equation, you can compare your performance to businesses in your industry - at company-level or even at facility, product or trip-level.
Example: Suppose you’re in the logistics business, and one of your customers reaches out to you, asking for an emissions report on the deliveries you make to their sites. They are trying to calculate their own GHG emissions inventory and are reaching out to their suppliers, including you. Having added your trip-specific data to the Altruistiq app, you use the app to generate a customer-specific emissions report, which includes not only the total tCO2e emissions generated by activity with that customer, but also a comparison of kgCO2e/km travelled intensity of deliveries using your business as compared to a number of industry averages. Due to the emissions reduction initiatives you’ve implemented, the value is 0.200kgCO2e/km, compared to an industry average (diesel van) of 0.241kgCO2e/km, incentivising your customer to use your business for a larger share of deliveries to improve their emissions profile.
4. Comply with regulatory reporting requirements. Mandatory sustainability and climate impact reports in some countries require the inclusion of intensity metrics - for example the SECR reporting framework in the UK, which applies to publicly listed companies with >£36 million in annual revenue, requires at least 1 intensity metric to be consistently included year on year.
To decide which intensity metrics to use, consider the following:
What is most relevant at each level of reporting to meaningfully inform business decisions? For example, at company level this might be emissions per $ revenue, while at facility level it would be emissions per square metre.
What can you measure and report on accurately and consistently? For example, reporting on emissions per table manufactured might seem like a useful product-level metric, however if you have an evolving catalogue of a number of different table models, of different sizes, using different raw materials, this metric may be very difficult to measure accurately and may lose its utility at the high level of aggregation, and as its components change every year.
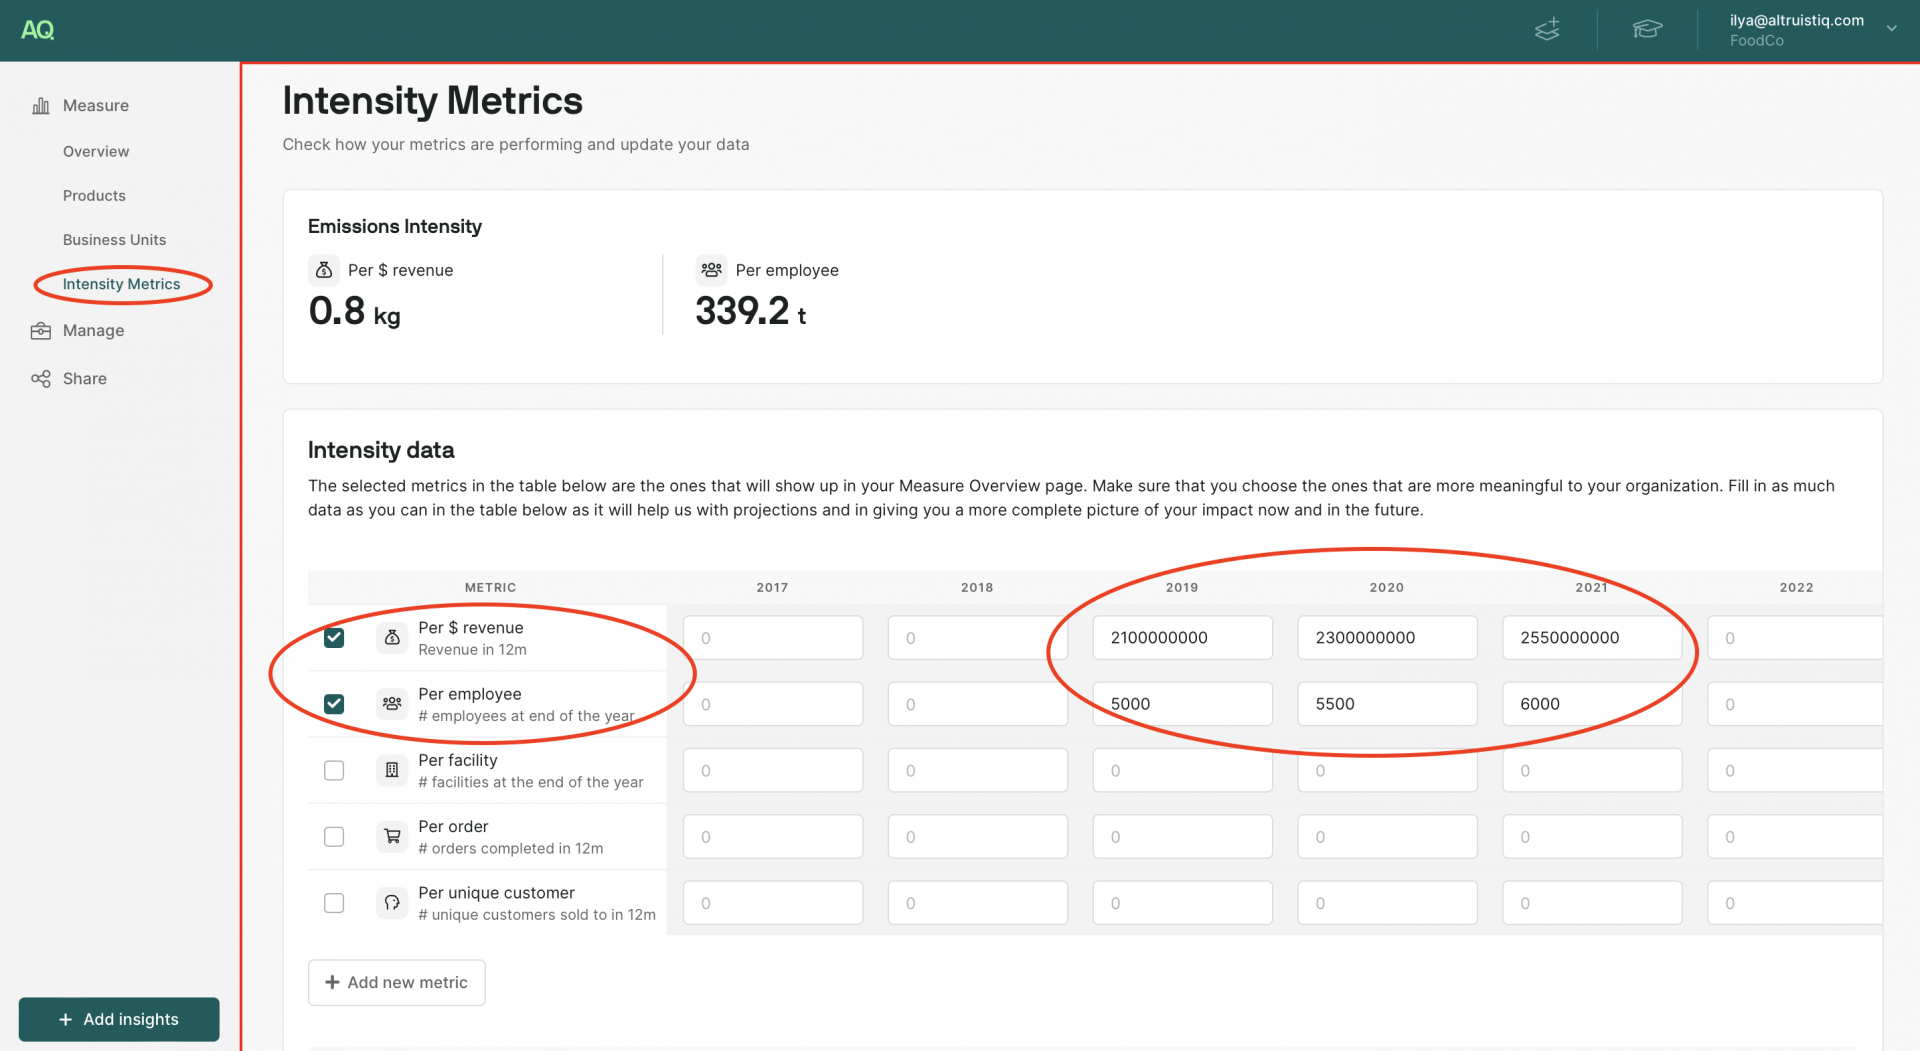
Navigate to “Intensity Metrics” within the “Measure” section of the app in the left tool bar.
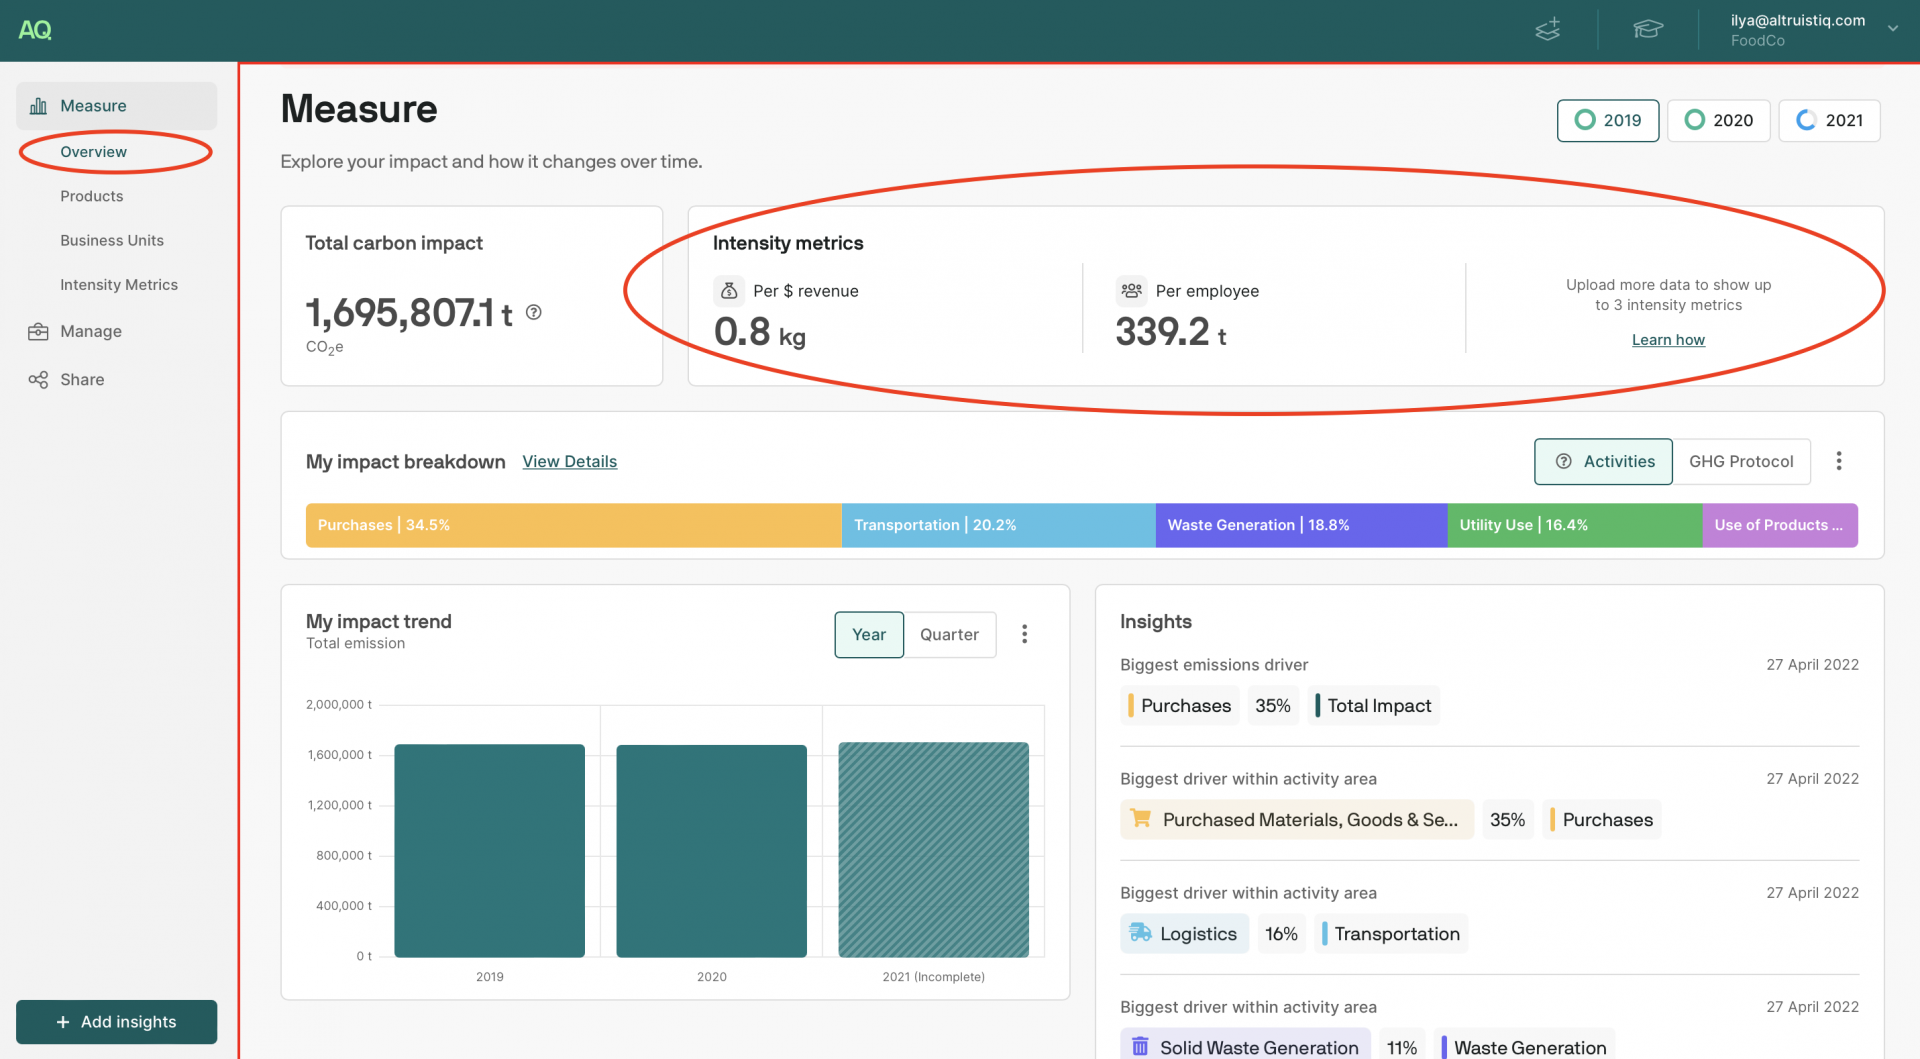
Input data for your business metrics (e.g. what your $ revenue was in each year) and tick the metrics that you would like to be displayed on your “Measure” dashboard. If you would like to create any new metrics, click “Add new metric” and add the relevant data. Once done, click “Save”.